




Your website receives visitors, but which ones become customers? A busy homepage can look encouraging while your contact form goes unused. An article with modest traffic might send more qualified inquiries than a page receiving hundreds of visits.
The best website analytics tools for small businesses help you connect website activity with useful business outcomes. Start with a question you need to answer: where visitors come from, which pages lead to inquiries, or where people struggle before completing a purchase.
Our shortlist covers different needs: Google Analytics 4 for marketing measurement, Plausible for straightforward reporting, Fathom for multiple websites, and Matomo for hosting flexibility. Microsoft Clarity helps you investigate usability problems, while Google Search Console shows how your pages perform in Google Search.
You do not need all six. Start with one main analytics platform, then add search or behavior reporting when it helps answer a specific business question.
Best Website Analytics Tools at a Glance

Choosing an analytics tool starts with what you want to understand. Some platforms help you measure traffic and conversions, while others reveal how visitors interact with your pages or find your business through Google Search.
Affiliate disclosure: Some links in this article may be affiliate links. If you make a purchase or sign up through one of them, NaturesMoney may earn a commission at no additional cost to you.
| Tool | Best For | Pricing Overview | What to Consider |
|---|---|---|---|
| Google Analytics 4 | Tracking marketing campaigns and website conversions | Free standard version; paid Analytics 360 available | Accurate event tracking and useful reports require setup |
| Plausible | Owners who want a simple, focused traffic dashboard | Paid plans based on traffic and features | Check website limits, event allowances, and included features |
| Fathom Analytics | Managing analytics across multiple websites | From $15/month, with 50 websites included | Websites and custom events share the plan’s usage allowance |
| Matomo | Businesses that want a choice of cloud hosting or self-hosting | Free self-hosted core; paid cloud hosting and premium features | Include maintenance, hosting, and optional features in your budget |
| Microsoft Clarity | Finding confusing layouts and usability problems | Free | Review recording settings, masking, and relevant visitor interactions |
| Google Search Console | Monitoring visibility and clicks from Google Search | Free | Covers Google Search performance rather than all website traffic |
For many small businesses, one primary analytics platform plus Google Search Console provides a useful starting point. Add Microsoft Clarity when you need to investigate how visitors interact with a particular page.
Paid prices and allowances can change, so confirm the current plan details before subscribing.
How We Compared These Tools
We compared these tools using official product pages, pricing details, and documentation, focusing on what matters to small business owners: useful reports, setup requirements, ongoing costs, and maintenance.
We also considered the different questions each tool answers. Traffic analytics helps you understand where visitors come from and what they do on your website. Heatmaps and recordings help you investigate usability problems, while search reports show how people discover your pages through Google.
Our recommendations are based on documented capabilities and practical business needs. We have not conducted hands-on comparative testing, and the examples in this guide illustrate possible uses rather than customer results.
When narrowing your options, consider who will review the reports and which decisions those reports will support. A tool earns its place when it helps you understand your website and take useful action.
1. Google Analytics 4 — Best for Marketing Measurement
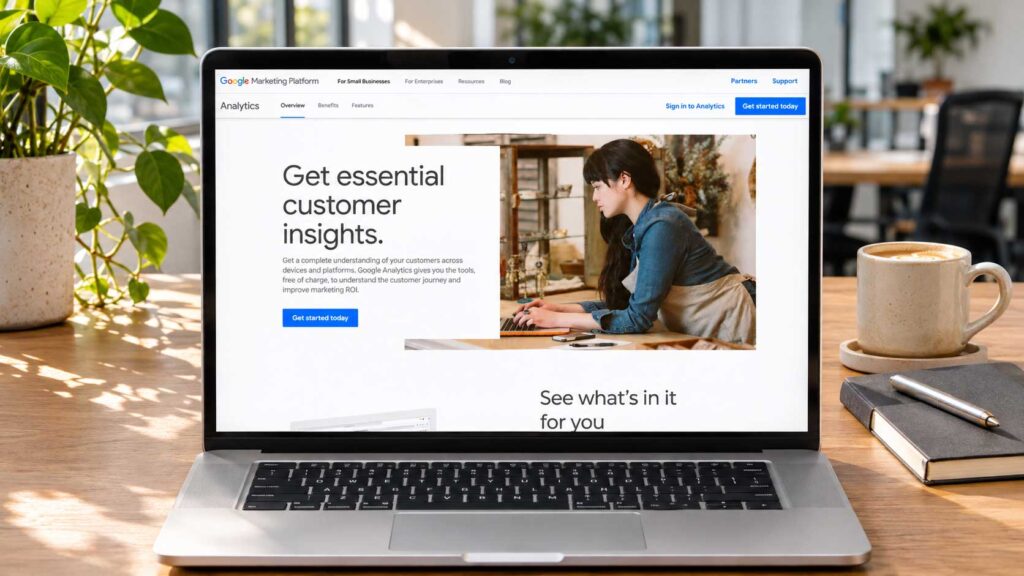
Google Analytics 4 helps you understand how people reach your website and which actions they take after arriving. The standard version is free, making it a useful starting point for small businesses that want to connect website activity with their marketing efforts.
Its value comes from measuring actions that matter to your business. A service company might focus on completed inquiry forms, while an online store might prioritize purchases. This helps you assess whether website traffic is contributing to your business.
What Can You Measure With GA4?
GA4 uses events to measure interactions. You can identify an important action and mark its event as a key event, then review the marketing channels associated with those actions. Google explains this process in its key event documentation.
For a small business, a useful measurement plan could focus on successful inquiries, confirmed bookings, purchases, or newsletter subscriptions. Each action needs a clear definition and appropriate tracking setup.
For example, a visitor clicking “Request a Quote” shows interest. Successfully submitting the quote form is a stronger signal. Keeping those actions separate makes your reports easier to interpret.
What Should You Check Before Relying on the Reports?
Validate your most important events before using them to judge marketing performance. Submit a test inquiry or complete a test purchase, then confirm that the recorded activity matches what happened.
Check unsuccessful submissions, repeated button clicks, and refreshed confirmation pages as well. These tests help uncover tracking that fires too early or records the same action more than intended.
Keep a short record of what each event measures, how it is triggered, and who maintains it. This makes troubleshooting easier when forms, plugins, or website layouts change.
Pricing and Setup Considerations
The standard version has no subscription charge, but implementation and reporting still require time. Include any professional setup, troubleshooting, and ongoing maintenance in your budget.
Start with a manageable reporting routine: where useful visits came from, which pages visitors entered through, and how many meaningful actions they completed. Add detail when you have a specific business question to answer.
Who Should Use Google Analytics 4?
GA4 suits small businesses that want to evaluate marketing channels and website outcomes, especially when someone can maintain the tracking and review the reports regularly.
It is worth considering for service businesses measuring inquiries, stores evaluating purchases, and publishers tracking subscriptions or referral activity. If you mainly want a quick traffic overview, compare its reporting workflow with the simpler dashboards covered below.
2. Plausible — Best for a Simple, Focused Analytics Dashboard
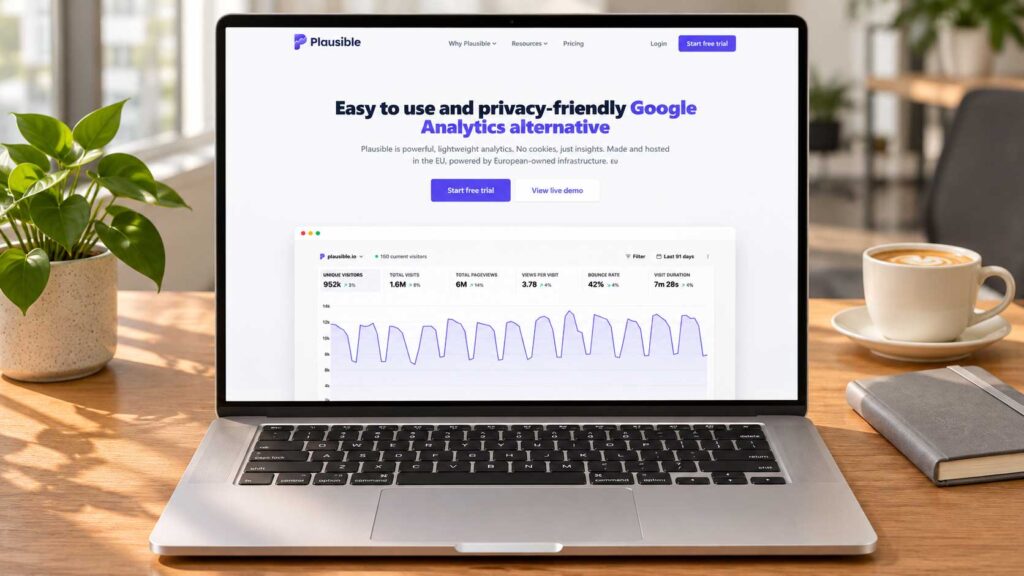
Plausible brings essential website statistics into a compact dashboard. It is worth considering if you want to understand your traffic without spending much of your working day navigating reports.
The platform describes its analytics as cookieless, without persistent identifiers or tracking across unrelated websites. Its appeal is a focused view of website performance with a privacy-conscious approach to measurement.
What Can You Measure With Plausible?
Plausible supports traffic reporting, campaign measurement, goals, and custom events. Depending on your plan, you can also use funnels, user journeys, and revenue tracking to examine how visits contribute to business outcomes.
For a small business, the practical starting point is straightforward: identify which sources bring visitors, which pages attract attention, and whether those visits lead to meaningful actions.
A publisher, for example, could compare articles that generate newsletter signups. A service business could focus on completed inquiry forms. Define the successful action before configuring the goal so your reports measure what you intend.
What Should You Check Before Choosing a Plan?
Check the features you need against the subscription you will actually keep. Plausible’s Starter plan is designed for solo use on one website. Growth adds collaboration and sharing options, while Business includes more advanced analysis features.
The trial provides access to Business features, so the dashboard you evaluate may include capabilities unavailable on a lower subscription. Use the official plan comparison to confirm your requirements before choosing.
During the trial, try answering three questions you regularly ask about your website. Check whether you can find and understand the answers without outside help.
Pricing and Usage Considerations
Plausible’s hosted subscriptions depend on your feature tier and traffic allowance. Both pageviews and custom events count toward usage across the websites in a team. This means tracking additional interactions can affect the allowance you need.
Estimate usage based on the actions you need to track. Recording every possible interaction can add reporting clutter as well as billable activity.
Compare monthly and annual billing, website limits, and access requirements before committing.
Who Should Use Plausible?
Plausible suits solopreneurs, publishers, and small business owners who want a focused reporting routine and are comfortable paying for hosted analytics.
It is particularly worth evaluating when your questions center on traffic sources, useful content, and a manageable set of business outcomes. Test the dashboard against those questions, then choose the plan that supports your routine.
3. Fathom Analytics — Best for Managing Several Websites
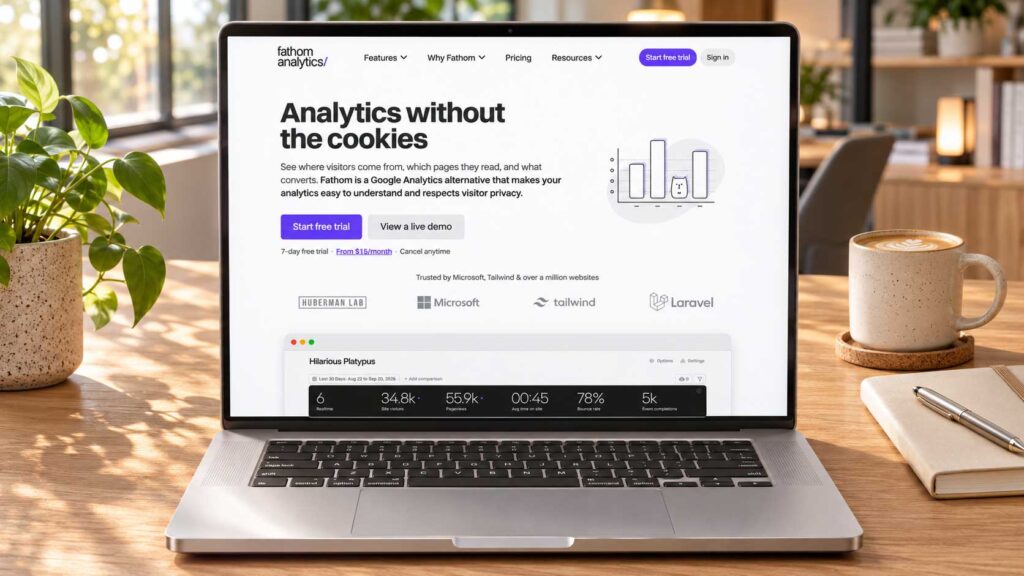
Fathom Analytics is worth considering if you manage several websites and want a consistent way to review their performance. Its entry subscription includes 50 websites, making it a practical candidate for publishers, small agencies, and owners with multiple business sites.
For example, an owner running a service website, a publication, and an online store could establish one reporting routine while keeping each site’s business goals separate.
What Can You Measure With Fathom?
Fathom includes event and revenue tracking, campaign tracking, shared dashboards, and exports. Its plans offer the same analytics features, with pricing primarily scaling according to usage.
Decide what you want each website to achieve. A service site might prioritize completed inquiries, a publication might track newsletter subscriptions, and a store might focus on confirmed purchases.
Use consistent definitions across similar websites, but preserve the differences between business models. An affiliate click and a completed sale should remain separate outcomes, even when you review both in the same reporting session.
The traffic allowance is shared across your websites, and custom events also count toward it. Having space for 50 websites does not give each website its own separate allowance.
For example, 70,000 pageviews plus 20,000 custom events would use 90,000 of the plan’s 100,000 monthly allowance.
Estimate usage across your entire portfolio before choosing a subscription. One busy website—or extensive event tracking—can account for much of the total.
Pricing and Trial Considerations
Fathom starts at $15 per month, with a shared monthly allowance of 100,000 pageviews and custom events across your websites. It offers a seven-day trial that requires a payment card and becomes a paid subscription unless canceled. Confirm the current terms on Fathom’s pricing page.
During the trial, evaluate whether the reports answer your regular business questions. Test an important event on each type of website you operate and check that its meaning remains clear when you return to the report later.
Who Should Use Fathom Analytics?
Fathom suits website portfolio owners, independent publishers, and small agencies looking for a consistent analytics workflow across several sites.
Its multiple-site allowance makes it worth comparing with alternatives that impose tighter website limits. The deciding factors should be your combined usage, required reporting depth, and how easily you can turn the reports into useful decisions.
Compare Fathom Analytics plans
4. Matomo — Best for Hosting Flexibility and Data Control
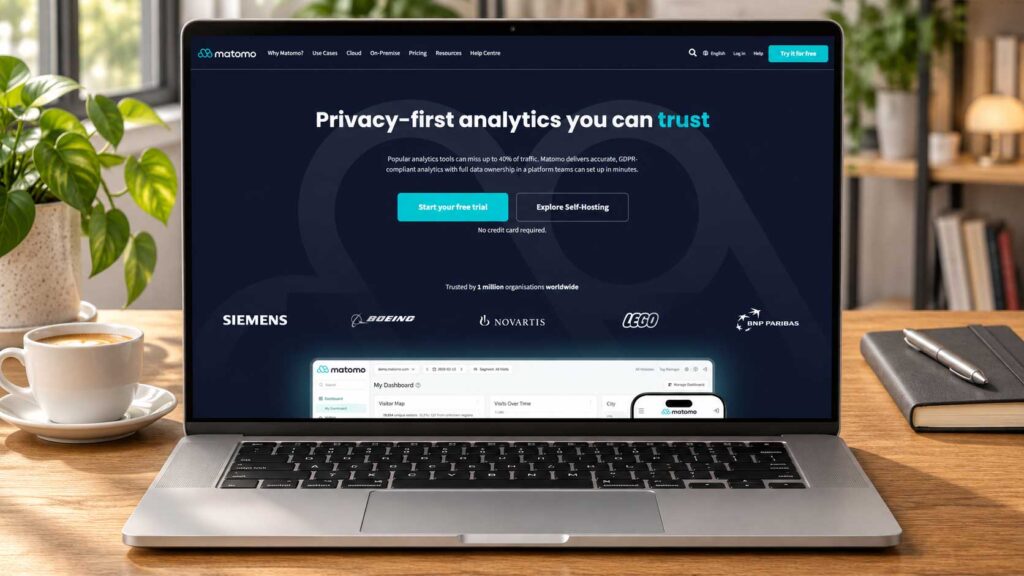
Matomo gives businesses a choice between a managed Cloud service and an On-Premise installation they operate themselves. Its self-hosted core is free and open source, while Cloud hosting, premium features, and support can involve additional costs.
Matomo is worth considering if your business has specific requirements for where analytics data is stored and who manages the system.
What Can You Measure With Matomo?
Matomo supports event, campaign, and ecommerce tracking, along with customizable dashboards. Additional capabilities include funnels, heatmaps, session recordings, and form analysis, depending on the hosting option and package you choose. Check the current feature comparison for your intended setup.
For a small business, start with the same practical questions you would ask of any analytics platform: which channels bring relevant visitors, which pages support inquiries, and where customers leave before completing an important action.
Build around those questions before adding more reports or advanced features.
Matomo Cloud vs. On-Premise
Matomo Cloud runs on infrastructure managed by Matomo. On-Premise lets you run the software on infrastructure you select and maintain. These options have different pricing structures and feature packages.
The practical decision is how much operational responsibility your business can handle. With self-hosting, somebody needs to manage installation, updates, backups, storage, and troubleshooting.
Before choosing that route, name the person responsible and agree on what happens when they are unavailable. A setup that depends entirely on one contractor can become difficult to maintain later.
What Does Matomo Actually Cost?
The On-Premise core has no software license charge, but running it still requires resources. Include hosting, maintenance time, technical assistance, and any premium features in your estimate. Matomo explains its free software model in its cost overview.
For Cloud, compare the subscription against your expected traffic and required capabilities. Avoid assuming that a feature included in one hosting package is included in another.
A useful comparison covers a full year of operation. This makes recurring subscriptions easier to compare with occasional maintenance or support expenses.
Who Should Use Matomo?
Matomo suits businesses with specific hosting requirements or teams that want to manage their own analytics infrastructure.
The self-hosted option deserves consideration when you have dependable technical support and a clear reason to operate the system yourself. Cloud is worth evaluating when you prefer a managed service.
Choose an option you can maintain, and make sure someone is responsible for keeping it working.
Compare Matomo hosting options
5. Microsoft Clarity — Best for Finding Website Usability Problems
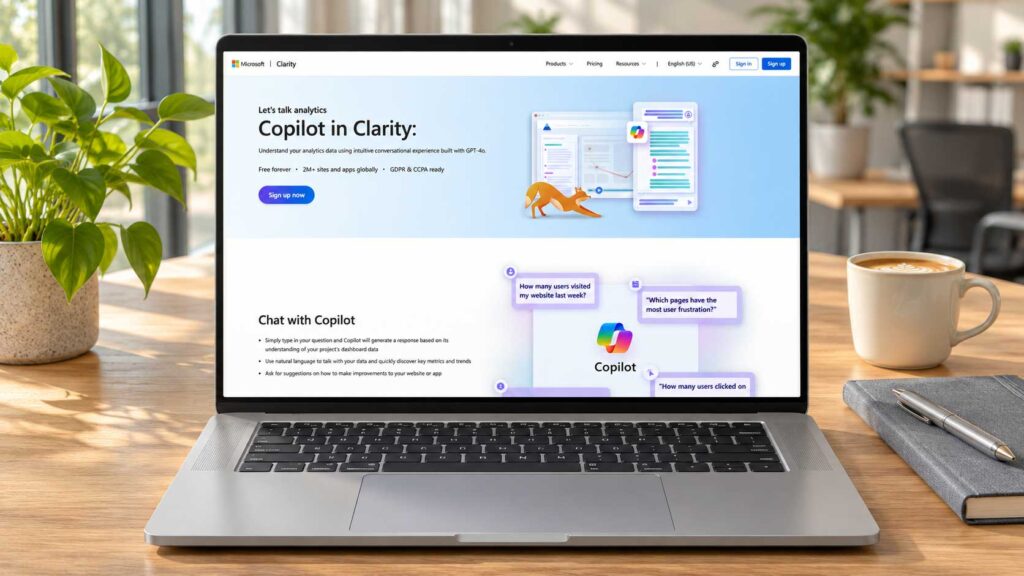
Microsoft Clarity helps you examine how visitors interact with your website through heatmaps and session recordings. It is free, making it an accessible option for small businesses investigating confusing layouts, overlooked buttons, or difficult customer journeys.
Its practical value is providing context. If your analytics reports show that visitors reach a service page but rarely submit an inquiry, Clarity can help you investigate what happens on that page.
What Can Heatmaps Show You?
Clarity’s heatmaps summarize visitor interactions, including where people click and how far they scroll. You can examine behavior across desktop, tablet, and mobile devices. Microsoft explains these views in its heatmap documentation.
For example, you might notice that visitors click an image that looks like a button, or that relatively few reach an inquiry form near the bottom of a long page.
These observations suggest questions to investigate. They do not automatically tell you whether visitors understood your offer or were ready to buy.
How Can Session Recordings Help?
Session recordings let you review individual visitor journeys, while filters help narrow your investigation to relevant pages, devices, or actions.
Start with a specific question rather than watching sessions at random. If mobile inquiries have fallen, review relevant mobile visits and test the form yourself. Look for repeated difficulties that you can reproduce, such as an obstructed button or confusing validation message.
A single frustrating session is a clue, not proof of a widespread problem. Compare several relevant visits and check the page directly before deciding what to change.
What Should You Check Before Collecting Recordings?
Review your recording configuration, masking, and consent setup. Microsoft documents how Clarity collects interaction and page information, including masked content for privacy-sensitive fields. See its data collection documentation.
Test representative pages to check what appears in playback. Pay particular attention to forms, account areas, and pages displaying customer information.
Also assign someone to review findings and act on them. A free tool still requires time to configure, interpret, and maintain.
Who Should Use Microsoft Clarity?
Clarity suits small business owners, website managers, and marketers who need to investigate a specific usability problem.
It is particularly useful when traffic reports reveal a weak point but leave you with unanswered questions about the page experience. Use those observations to propose a focused improvement, then assess whether the change helps visitors complete the intended action.
6. Google Search Console — Best for Monitoring Google Search Performance
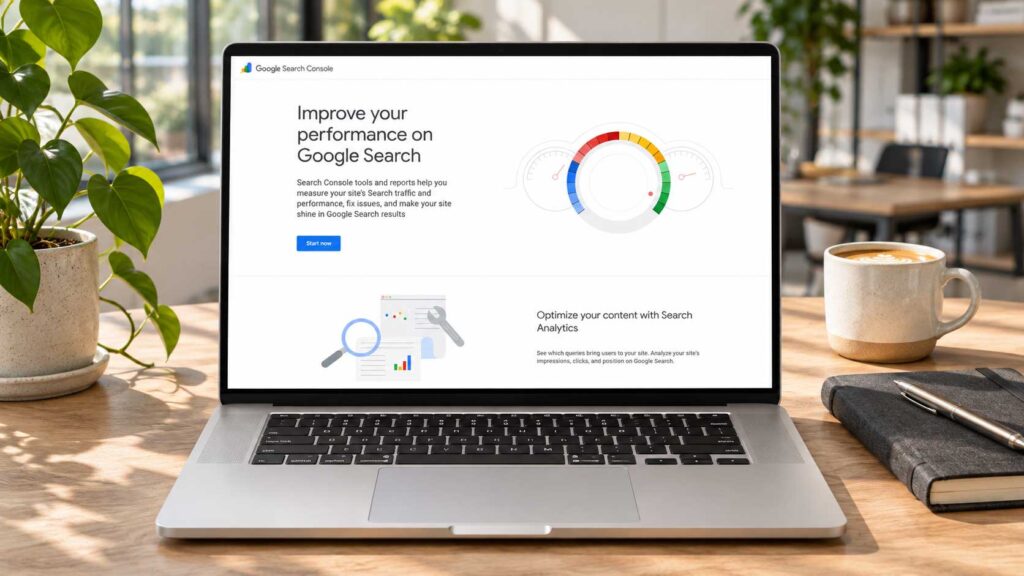
Google Search Console is a free service that helps you monitor and troubleshoot your website’s presence in Google Search. It provides search performance data and tools for investigating crawling and indexing problems.
For a small business, its value is understanding how potential customers discover your pages through search. You can use that information to identify relevant content opportunities and investigate changes in search traffic.
What Can You Measure With Search Console?
The Performance report shows clicks, impressions, click-through rate, and average position. You can examine results by query, page, country, and device to understand where changes are happening. Google explains these metrics in its Performance report guide.
An impression means your website appeared in search results; it does not mean somebody visited. Click-through rate is the proportion of impressions that resulted in clicks.
For example, a service page receiving more impressions without additional clicks deserves a closer look. Check whether the queries match your offer and whether the page’s title clearly describes what customers will find.
How Can It Help You Improve Your Website?
Search Console can help you investigate whether Google can find and index your content, alongside monitoring search performance. These functions make it useful when reviewing new pages or troubleshooting an unexpected decline.
A local business could review which service pages attract relevant search clicks before deciding what to improve. A publisher could examine the queries associated with an existing article and identify questions that deserve clearer answers.
Use these observations to guide useful changes. A query appearing in a report is a reason to investigate reader needs, rather than automatically create another article.
What Should You Check When Comparing Results?
Keep your date ranges, filters, and search types consistent. Comparing different devices, countries, or periods can produce a misleading impression of growth or decline.
Average position also needs context. Google defines it using the topmost result from your site within the relevant grouping; it is not a fixed ranking that every searcher sees.
Keep search visibility separate from business results. More impressions can be encouraging, but review whether the destination pages also generate useful inquiries, subscriptions, or purchases.
Pricing and Practical Considerations
Search Console has no subscription charge. Your main investment is time: reviewing reports, investigating issues, and making improvements.
Start with a manageable routine. Examine meaningful changes, identify the affected pages, and choose a specific question to investigate. Avoid rewriting pages in response to every daily fluctuation.
Who Should Use Google Search Console?
Search Console suits small business owners, publishers, and website managers who rely on Google Search to attract customers or readers.
Use it alongside your primary analytics platform to connect search visibility with activity on your website.
For keyword research, competitor analysis, and website auditing beyond Search Console, explore our guide to SEO tools for small businesses.
Get started with Google Search Console
Traffic Analytics, Heatmaps, and Search Reports: What Is the Difference?
These tools examine different parts of the customer journey. Traffic analytics helps you understand how visitors arrive and what they do on your website. Heatmaps and recordings reveal interaction patterns, while search reports explain how your pages appear in Google Search.
Knowing the difference helps you choose the right tool for the question you need to answer.
| Business Question | Measurement Approach | How to Use the Answer |
|---|---|---|
| Which sources bring relevant visitors? | Traffic and campaign reporting | Compare channels alongside meaningful actions, such as completed inquiries |
| Which pages contribute to inquiries or purchases? | Event tracking and journey analysis | Identify useful pages and check that completed actions are measured accurately |
| Where might visitors struggle? | Heatmaps, session recordings, and direct testing | Look for repeated difficulties and test a specific improvement |
| Which searches bring visibility and clicks? | Search performance reporting | Review relevant queries, improve existing pages, and investigate content gaps |
| Which inquiries become paying customers? | CRM, booking, and transaction records | Assess lead quality, completed sales, and customer value |
Traffic Analytics: Where Visitors Come From and What They Do
Traffic analytics helps you compare sources such as search, email, social media, and paid campaigns. With appropriate event tracking, you can also examine meaningful actions visitors complete after arriving.
For example, one campaign might generate more visits while another produces more qualified inquiries. Reviewing both traffic and outcomes gives you a better basis for deciding where to spend your time or budget.
Heatmaps and Recordings: How Visitors Interact With Pages
Heatmaps summarize interaction patterns, while recordings provide context around individual visits. They can help you investigate an overlooked button, confusing navigation, or a difficult mobile form.
Use these observations to identify possible problems, then test them directly. Repeated clicks or limited scrolling can suggest a difficulty, but they do not explain every visitor’s intentions.
Search Reports: How People Discover You Through Google
Search reports help you examine the queries and pages associated with your visibility in Google Search. They are useful for understanding whether your content is appearing for relevant searches and attracting clicks.
Connect that information with what happens on the destination page. Search visibility becomes more useful when it brings people who need your content, products, or services.
Business Records: What Happens After the Website Action
A submitted inquiry is a potential customer, not a completed sale. Website tracking alone may not reveal whether the request was suitable, an appointment took place, or the work was profitable.
Review qualified leads and completed sales through your CRM, booking system, or transaction records. Use those records to assess lead quality and revenue alongside the actions reported by your analytics platform.
Define the Outcome Before Installing Another Tool
Before choosing analytics software, decide what you want your website to achieve. More visits can be encouraging, but the most useful measures connect those visits with inquiries, purchases, subscriptions, or other actions that support your business.
Choose one primary outcome, then track a few supporting actions that help you understand the journey toward it.
Local Service Businesses
For a service business, a successfully submitted inquiry or confirmed appointment is a useful starting point. Follow those requests through your business records to see which become qualified leads and completed jobs.
Keep expressions of interest separate from completed actions. A click on your phone number suggests someone may want to call, but it does not confirm that the call connected or a service was booked.
Lead quality matters, too. Distinguish promising requests from spam, general questions, and work outside your service area. A smaller number of suitable inquiries can be more valuable than a busy inbox filled with requests you cannot serve.
To follow inquiries beyond the initial form submission, explore our guide to the best CRM software for small businesses. It compares tools for organizing leads, follow-ups, and sales opportunities.
Online Stores
For an online store, prioritize confirmed purchases and revenue, using product views, cart additions, and checkout starts to understand the steps leading to a sale.
Compare analytics results with actual order records. When assessing business performance, account for cancellations and refunds rather than treating every initially recorded purchase as retained revenue.
Test the purchase journey before using reports to evaluate advertising. Complete a test order and check that the transaction is recorded correctly. Duplicate purchase events can inflate reported results and lead to poor spending decisions.
Your store’s reporting and integration options also depend on its platform. Compare the best ecommerce platforms for small businesses when evaluating how you will manage orders and connect your analytics.
Publishers and Affiliate Websites
For publishers, useful outcomes may include confirmed newsletter subscriptions and relevant outbound affiliate clicks. Track these separately because they serve different purposes.
A newsletter subscription builds an audience you can reach again. An affiliate click sends a visitor to a merchant, but it does not establish that a purchase occurred or a commission was earned. Review confirmed transactions and payouts through the affiliate program’s reports.
Evaluate content according to its role. A buying guide may generate merchant clicks, while an informational article introduces readers to your website or helps them reach related content. Review performance over a meaningful period before deciding whether to improve, combine, or remove a page.
If newsletter subscriptions are a primary goal, our guide to the best email marketing software for small businesses can help you compare platforms for collecting subscribers and maintaining those relationships.
A Practical Small Business Measurement Plan
A useful measurement plan explains what you will track, when each action counts, and how you will check that the data is accurate. Keep it focused on the decisions you need to make.
The examples below are a planning framework. Your chosen platform may require additional configuration or integrations to measure them.
| Action | When It Should Count | How to Validate It | What It Tells You |
|---|---|---|---|
| Inquiry submitted | The form successfully accepts the request | Submit a test inquiry and confirm the form record and tracking event | A potential lead was received |
| Booking completed | The booking system confirms an appointment | Complete a test booking and check how cancellations are handled | An appointment was scheduled, with attendance reviewed separately |
| Purchase completed | A successful order is recorded with a unique transaction ID | Compare a test order with analytics and check for duplicates | A purchase occurred, with refunds and cancellations reviewed separately |
| Newsletter subscribed | The subscriber completes your signup process, including confirmation if required | Test the full process and check the subscriber record | Your mailing list gained a subscriber |
| Affiliate link clicked | A visitor follows a designated merchant link | Check the destination and confirm the intended event fires | Referral interest, with earnings verified through the affiliate program |
Document Each Event Clearly
For every event, record its name, the action that triggers it, who maintains it, and what should happen during a test. Use names that make sense to the person reviewing the reports.
Also note what the event does not establish. An inquiry submission does not confirm a suitable lead, and a scheduled appointment does not confirm attendance. These distinctions keep reports grounded in what you actually know.
Test Before Using the Numbers
Check successful actions alongside failed submissions, repeated clicks, and refreshed confirmation pages. Confirm that each event fires when intended and that the counting matches your definition.
Repeat the relevant checks after changing forms, checkout systems, booking tools, or tracking settings.
Keep Personal Information Out of Tracking
Use descriptive labels such as “Contact Form” or “Consultation Booking.” Avoid including customer names, email addresses, phone numbers, or message content in event labels or URLs.
Your measurement plan should describe the action clearly without copying the customer’s personal information into analytics.
How to Choose the Right Analytics Setup
The right analytics setup should answer your business questions, fit your budget, and be manageable for the person using it. Before committing, check how each option would fit into your regular work.
Start With Your Existing Tools
Review the reports already available through your website, online store, booking system, or CRM. Identify the question you still cannot answer.
Your booking system may already show confirmed appointments, for example, while you need better information about which website pages encourage people to book. That gives you a specific gap to address.
Add a tool when it contributes useful information or makes an important task easier.
Match Complexity to the Person Reviewing the Data
Choose reports that somebody in your business can understand and use consistently.
A solo owner with twenty minutes a week might focus on traffic sources, important landing pages, and completed inquiries. A business with dedicated marketing support may need more detailed analysis.
During evaluation, ask the person responsible to answer a real business question using the dashboard. Notice how much explanation or extra work is required.
Compare the Full Cost
Look beyond the advertised subscription. Include initial configuration, troubleshooting, maintenance, and the time needed to review results.
For usage-based plans, estimate activity across every website you intend to connect, including billable events where applicable. For self-hosted software, include infrastructure, backups, updates, and technical support.
Compare equivalent billing periods and the features you actually need. An inexpensive plan loses its appeal if it requires substantial additional work or an immediate upgrade.
Check Compatibility With Your Website
Before committing, confirm that your chosen tool works with your forms, checkout, and booking system. Pay particular attention to actions completed on another domain or through an embedded service.
Check what additional configuration, integrations, or technical help you will need to measure the full journey.
Review What Your Setup Collects
Understand which interactions your configuration records, what information it sends, and which pages should be excluded. Check forms, customer account areas, and URLs for information that should stay out of analytics.
Review the complete website setup, including other scripts and integrations. A cookieless analytics product does not determine how every other tool on your website behaves.
Assign responsibility for these settings and revisit them when your website changes. Seek appropriate advice when you need to assess requirements for a particular jurisdiction.
A Weekly Analytics Routine That Leads to Action
A regular review helps you turn website data into practical improvements. Set aside a manageable amount of time each week and begin with the outcome your website is meant to support.
Review Business Outcomes First
Start with completed inquiries, confirmed bookings, purchases, or subscriptions. Then examine the pages and channels associated with those actions.
Compare equivalent periods, taking holidays, seasonal demand, and campaign changes into account. If traffic rises but useful inquiries remain flat, investigate whether the additional visitors match your offer.
Check That Everything Still Works
When results change unexpectedly, test the customer journey before drawing conclusions about demand.
Submit an inquiry, check the booking process, or test checkout as appropriate. Confirm that the action succeeds and appears in both your business records and analytics.
A broken form can prevent inquiries, while a tracking problem can hide actions that customers successfully completed. Those situations require different fixes.
Choose One Question to Investigate
Focus each review on a question you can act on. For example: why does a service page attract relevant visitors but produce few inquiries?
Inspect whether the page explains the service, coverage area, pricing approach, and what happens after someone makes contact. Use relevant reports and direct testing to narrow down possible obstacles.
Choose a focused change where practical. Making several unrelated changes together makes it harder to understand what contributed to the result.
If a campaign needs a more focused destination, compare the best landing page builders for creating pages around a clear inquiry, signup, or purchase goal.
Record the Change and Review It Later
Keep a short decision log covering what you observed, your explanation, what you changed, and what happened afterward. Include the date and any relevant campaign or website changes.
Allow enough time to collect useful evidence. A low-traffic website may need several weeks or longer before a pattern becomes clear, so weekly reviews do not need to produce weekly edits.
Use the routine to identify worthwhile work, check previous changes, and build a clearer understanding of what helps your visitors become customers or subscribers.
Common Website Analytics Mistakes
Useful reports depend on clear definitions, reliable tracking, and careful interpretation. These common mistakes can make website performance look better—or worse—than it really is.
Reporting Visits Without Business Outcomes
A growing audience is encouraging, but traffic alone does not show whether your website is helping the business.
Review visits alongside qualified inquiries, confirmed orders, subscriptions, or other relevant outcomes. If traffic increases without meaningful actions, investigate whether you are attracting the right audience and giving visitors a clear next step.
Installing Duplicate Tracking
The same tracking code can accidentally be installed through a plugin, theme setting, and tag manager. Depending on the configuration, this can cause duplicate activity and inflate reports.
Keep a record of where each tool is installed and who maintains it. When changing your setup, check the existing installation before adding another copy, then validate the affected events.
Treating Every Click as a Conversion
Clicking “Book Now” shows interest; completing a booking confirms an appointment. Combining these actions under one label makes it difficult to understand what visitors actually accomplished.
Name events according to the action they measure. Keep supporting interactions separate from completed outcomes so your reports preserve the difference.
Comparing Incompatible Totals
Search clicks, analytics sessions, and recorded visits describe different things. Collection methods, consent choices, blocked scripts, bot filtering, and reporting settings can also produce differences between tools.
Investigate substantial or unexpected discrepancies, but first check that you are comparing the same dates, pages, and definitions. Matching totals should not be the only test of accuracy.
Changing Too Much at Once
Changing your offer, page layout, campaign audience, and tracking at the same time makes results harder to interpret.
Where practical, make a focused improvement and record when it went live. If several changes are necessary, document them together and acknowledge that you may not be able to isolate each change’s contribution.
Frequently Asked Questions About Best Website Analytics Tools
What Is the Best Website Analytics Tool for a Small Business?
The best choice depends on what you need to understand. Consider GA4 for marketing measurement, Plausible for a focused dashboard, Fathom for managing several websites, and Matomo when hosting control matters. Microsoft Clarity helps investigate visitor interactions, while Search Console provides insight into Google Search performance.
Is Free Website Analytics Enough?
Yes, a free setup can be enough if it measures your important business outcomes accurately and provides reports you can use. Paid software becomes worth considering when it solves a specific reporting or workflow problem. Either option still requires time for setup, maintenance, and review.
Do I Need Both Google Analytics and Search Console?
Using both can be helpful because they cover different parts of the journey. Search Console shows how your website performs in Google Search, while Google Analytics helps you examine activity after visitors arrive. Together, they can help connect search visibility with meaningful website actions.
Can Heatmaps Tell Me Why Customers Do Not Buy?
Heatmaps can reveal interaction patterns, such as overlooked buttons or clicks on elements that do not respond. Recordings provide additional context, but neither explains every visitor’s motivation. Use them alongside direct testing, customer feedback, and purchase data to investigate possible obstacles.
Does an Affiliate Click Count as Revenue?
No. An affiliate click means someone followed a referral link; it does not confirm a purchase or commission. Check approved transactions and payouts in the affiliate program’s reports, allowing for cancellations, returns, and other adjustments.
Will Analytics Increase My Sales?
Analytics can help you identify opportunities and evaluate changes, but installing software alone will not increase sales. Results depend on how you use the information to improve your offer, attract relevant visitors, address website problems, and follow up with potential customers.
Our Recommendation
Start with one primary analytics platform and one meaningful business outcome, such as a completed inquiry, confirmed purchase, or newsletter subscription. Build a reporting routine around that goal before adding more tools.
Our starting choice is Google Analytics 4 for businesses that need marketing measurement and can invest time in setup. Compare Plausible and Fathom if a focused paid dashboard better fits your workflow. Consider Matomo when hosting flexibility and control over your analytics environment are priorities.
Use Google Search Console alongside your main platform when search visibility matters. Add Microsoft Clarity when you need to investigate a specific page experience, such as visitors struggling with a form or overlooking a booking button.
The best website analytics tools for small businesses help you decide what to improve and assess whether your changes are working. Choose a setup you can maintain, check that it measures actions accurately, and make reviewing the results part of running your business.
More Tools to Grow Your Small Business
Explore these related guides to improve your website, attract relevant visitors, and manage the inquiries your marketing generates:
- Best SEO Tools for Small Businesses — Research keywords, investigate competitors, and identify website improvements.
- Best Landing Page Builders — Create focused pages for campaigns, inquiries, and signups.
- Best CRM Software for Small Businesses — Organize leads and follow their progress toward a sale.
- Best Email Marketing Software — Build your mailing list and stay connected with potential customers.